Sometime ago Business-week posted these two news flow on US-China spat. It reminded me of the cry of YEN been undervalued relative to USD in the 80's. Currency has always been a bone of contention between two trading partners esp. if one side seems to derive large competitive advantage over considerably longer time. But weaker currency position as well as stronger currency positions have inbred costs within them. And these cost could be huge if not handled carefully.
Phase 1 : Central Banks believe Strong Currency = Strong Economy
During the short period of time Gold standard lived after the First World war, the major powers of the world USA, Britain, Germany and France believed that the most important job of the central bank was to support the value of currencies against a fixed ounces of gold. This belief was put in to practice by head of the Central Banks: Montagu Collet Norman of Bank of England, Benjamin Strong of the New York Federal Reserve Bank, Hjalmar Schacht of the Reichsbank, and Émile Moreau of the Banque de France.
In December 1930, the great economist Maynard Keynes published an article in which he described the world as living in “the shadows of one of the greatest economic catastrophes in modern history.” The world was then 18 months into what would become the Great Depression. The stock market was down about 60%, profits had fallen in half and unemployed had climbed from 4% to about 10%.
What followed was a period of Great Economic depression and unfortunately it was more acute in countries where the Central Bank tried to prop up their currencies. The Great Economic depression was thus more acute in Britain and France, two of the countries that tried to do everything that was considered to be most prudent at that time. It was relatively less severe in USA and Germany.
Germany and to some extent USA actually went out of their way by to break themselves away from the Gold standard without realizing it at first and with full intention of restoring the Gold Standard as and when economic conditions were correct to do so for each country. Germany devalued its currency to make its exports cheaper so that it can try and payback or negotiate better terms with Allies than in The treaty of Versailles. As for USA, by the end of first world war as a result of War financing, USA was left with the worlds largest holding of gold. To return to gold standard would have either made US export uncompetitive by raising value of Dollar with respect to gold or would have led to massive Inflation as US printed more currency to adjust for increased holdings of Gold after the Great war.
But the flawed policy of supporting currency at the cost of Economy lead to a period of depression: period of High Unemployment and slow growth.
Phase 2 : Central Banks believe Weak Currency = Larger Exports = Large Reserves = Strong Economy
Its about 80 years since then and the Central Bankers of the world have moved to the other extreme: Debasement of currency through various tools at their disposal to support their economy and in the process try and boost economic growth.
The most simplistic reasoning would suggest that an overtly strong currency relative to real economic activity would lead to High Unemployment and Depressed Economy while Highly Debased Currency would lead to High Inflation with a Nominal Growth Rate but not necessarily real growth and Increasing asset prices and fall in purchasing power of the money.
Keynes thus favored Fiscal actions by government over monetary instruments in dealing with Depressions and other economic problems. As he believed that during harsh times fiscal spending would help spur economy more than the spending resulting in Growth of economy followed by higher Tax collections to offset for higher fiscal spending(and deficit) during lean years. Resulting in natural checks and balances of Economy. Keynes believed and rightly so that contraction or expansion of a Central Banks Balance sheet would result in a permanent change from which it would be very hard to move back.
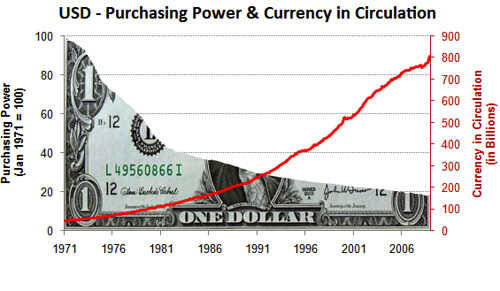
Looking at data, from Jan 1971 to Dec 2008, The U.S. money supply increased 16.8 times and this was accompanied by 81.1% drop in purchasing power of the Dollar as implied by CPI data. Thus a 17 times increase in Money Supply relates to a Five time fall in Purchasing Power. While this does means there is some there is some co-relation between the two data sets this does not necessarily means a Cause-effect relationship. The signifcant gap could be explained by :
- Increases in Productivity: This was the period that saw one of the most significant increases as a result of productivity gains.
- Over Valued asset prices. (stocks, Bonds, Real estate).
- Under reporting of CPI or over reporting of Money supply.
It is interesting at the same time to look at the strategy of East Asian Currencies as well as Chinese Yuan. The countries focussed on developing a export oriented economy working on strategy best explained by Warren Buffet's video:
By focusing more on exports they built up huge Trade surpluses in USD (that USA was debasing continuously) now these trade surplus could be deployed by these countries in buying the assets world over esp. USA. No doubt that China is expected to lead M&A activity. But this strategy should have resulted in Chinese Yuan rising compared to US dollar such that in few years time China should have lost its competitive advantage that it derives purely as a result of its undervalued currency. Most countries thus relegated themselves to a policy of central Bank intervention whenever their Local Currency started to strengthen against Dollar. This market intervention meant the Central Bank would buy Dollars and artificially prop up Dollar and sell local Currency. With each country trying to outsmart its Trade Partner the country that won the game through Debasement of its currency was the one with the weakest currency.
It sometime pays to learn history. As Rome tried to expand across the world it Financed its growth by debasing its currency. The continuous debasement of Roman coinage was followed by a period of Hyperinflation.
The Roman Monetary Crisis of the Third Century
"Trade during the third century was severely limited by the rapid debasement of Roman coinage (Sinnigen and Boak 401). In order to pay the army and Roman bureaucracy, the emperors had to produce more coinage. They could not issue promisory notes and run a deficit as do modern governments today, so their only recourse was to produce more money. Unfortunately, producing more money devalues the existing money supply, causing inflation.
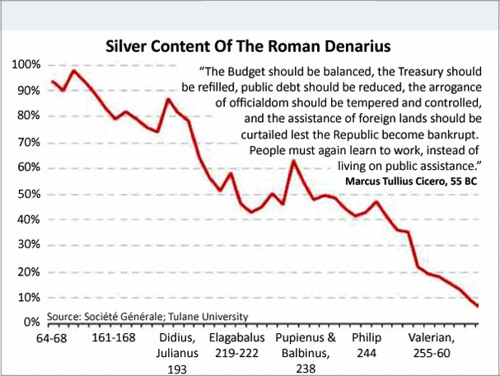
Since the supply of silver billion was limited, the emperors were able to produce more coinage by mixing the silver with base metals such as bronze or iron. They also repeatedly lowered the weight of the coins, requiring even less silver. Since they produced a glut of these coins at once and the debased coins were supposed to be of the same value as less debased coins, massive inflation resulted. At first the severely debased coins were held at the same value as the less debased coins, but as coins started to be made of far less silver than base metals, the severely debased coins became undesireable (ibid.). As a result, the coinage issued by the mid-third century emperors was undesirable and sometimes worthless. It became harder to trade and goods became more expensive. Responses to this inflation included reverting to a barter system and valuating coins on the amount of silver they contained (Drinkwater 207; Grant 44)."(The complete analysis can be had here :The Roman Monetary Crisis of the Third Century)
There are few reasons why this might not happen as fast as it happened in case of Roman Empire with the Modern Economies of the world.
- Its much easier for people to notice and adjust prices to Gold/Silver coinage debasement. While adjusting to debasement of Modern Currency is much more nuanced much harder for Common man to perceive ( Unless printing % increases a lot like in Germany around early 1930s).
- People adjust to Debasement proportionately. As gold/silver were real commodities whose value could be estimated. A 10% debasement in currency must have had increased prices of goods in the same proportion.
- Lastly Modern Currencies are driven by economic expectation of future performance of the Economy issuing the currency. As in the end Currency do represent a store for value and a promise of having capacity to buy an asset of equivalent worth. So till investors and Traders continue with the bet that a particular Currency is strong the currency would remain an acceptable source of conducting trade and commerce.
But having said that History always has a wild way of catching with us on our misdeeds. More the currency gets debased more they would loose their purchasing power and would lead to inflation in the economy. Central Bankers really need to think if this an acceptable Risk to go with.
Lastly below is last few sets of Data. And I do hope countries do not go on expanding their monetary base at a faster rate than the economic activity necessitates. In the end economic growth happens as a result of Growth in Real Economic activity and increase in productivity gains that pushes the productivity possibility frontier of an Economy. While Monetary and Fiscal adjustments can help in short term only these real gains can help in the long term.
Twenty Fastest Growing Currencies in Relative Terms
Rank | Country | Currency Code | Y-O-Y Increase in M0 | Date | ||
Billions | % | US$ Billions | ||||
1 | Iran | IRR | 77855.0 | 97.4% | 8.2 | Mar-09 |
2 | Iceland | ISK | 7.4 | 58.7% | 0.1 | Aug-09 |
3 | Angola | AON | 46.6 | 47.1% | 0.6 | Apr-09 |
4 | Tajikistan | TJS | 0.4 | 37.9% | 0.1 | Jul-09 |
5 | Iraq | IQD | 5182.2 | 35.1% | 4.5 | Feb-09 |
6 | Venezuela | VEF | 4.4 | 29.6% | 2.1 | Aug-09 |
7 | UAE | AED | 7.7 | 26.5% | 2.1 | Mar-09 |
8 | Albania | ALL | 40.9 | 26.4% | 0.5 | Dec-08 |
9 | Israel | ILS | 6.9 | 25.1% | 1.8 | Aug-09 |
10 | Lebanon | LBP | 453.2 | 24.7% | 0.3 | Aug-09 |
11 | Sudan | SDG | 1.2 | 21.8% | 0.5 | Mar-09 |
12 | Turkey | TRY | 5.9 | 21.0% | 3.9 | Aug-09 |
13 | Azerbaijan | AZN | 0.6 | 20.8% | 0.7 | Mar-09 |
14 | Algeria | DZD | 277.3 | 20.6% | 3.8 | Mar-09 |
15 | Tanzania | TZS | 225.8 | 19.8% | 0.2 | Mar-09 |
16 | Libya | LYD | 1.0 | 19.3% | 0.4 | Jul-09 |
17 | Suriname | SRD | 0.1 | 18.8% | 0.0 | Jun-09 |
18 | India | INR | 1093.6 | 18.6% | 22.6 | Aug-09 |
19 | Pakistan | PKR | 176.2 | 17.3% | 2.1 | Aug-09 |
20 | Philippines | PHP | 62.5 | 16.3% | 1.3 | Jun-09 |
Twenty Fastest Growing Currencies in Terms of US Dollars
Rank | Country | Currency Code | Y-O-Y Increase in M0 | Date | ||
Billions | % | US$ Billions | ||||
1 | EU | EUR | 87.9 | 13.4% | 125.7 | Aug-09 |
2 | US | USD | 81.4 | 10.5% | 81.4 | Aug-09 |
3 | China | CNY | 355.5 | 11.5% | 52.1 | Aug-09 |
4 | India | INR | 1093.6 | 18.6% | 22.6 | Aug-09 |
5 | Iran | IRR | 77855.0 | 97.4% | 8.2 | Aug-09 |
6 | UK | GBP | 4.2 | 8.4% | 6.8 | Mar-09 |
7 | Japan | JPY | 551.6 | 0.8% | 5.9 | Aug-09 |
8 | Brazil | BRL | 8.5 | 11.1% | 4.6 | Aug-09 |
9 | Mexico | MXN | 60.5 | 14.9% | 4.6 | Aug-09 |
10 | Iraq | IQD | 5182.2 | 35.1% | 4.5 | Aug-09 |
11 | Switzerland | CHF | 4.6 | 11.5% | 4.3 | Feb-09 |
12 | Turkey | TRY | 5.9 | 21.0% | 3.9 | Aug-09 |
13 | Poland | PLN | 11.1 | 10.2% | 3.9 | Aug-09 |
14 | Australia | AUD | 4.6 | 11.2% | 3.9 | Aug-09 |
15 | Algeria | DZD | 277.3 | 20.6% | 3.8 | Aug-09 |
16 | S Korea | KRW | 4462.7 | 15.6% | 3.6 | Mar-09 |
17 | Canada | CAD | 3.4 | 6.8% | 3.2 | Aug-09 |
18 | Hong Kong | HKD | 21.6 | 13.3% | 2.8 | Aug-09 |
19 | Egypt | EGP | 14.9 | 13.3% | 2.7 | Aug-09 |
20 | Taiwan | TWD | 85.6 | 10.8% | 2.6 | Jun-09 |