I was listening to Samavat 2066-67 with some analyst arguing that the new decade is to India the way the last Decade has been for China. For some reason I did not readily buy that argument and want to test the merit of the reasoning of the analyst.
First and foremost reasoning been offered by most analysts, is it to look at India as what China was 10 years before. Taking this as basic premise and then extrapolating the growth of China to make a case for India. Somehow within this most Analysts forget or try and underestimate the unique conditions that exist in both the countries. They also forget that both India and China have taken two very different economic choices of which I would try and propose my views in another post latter.
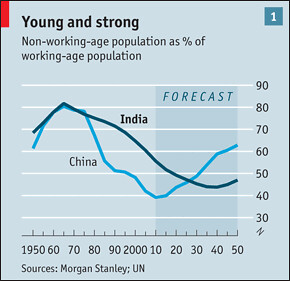 The second reasoning and importantly this is been offered to show sustainability of Future growth projections is "India's Demographic Dividend". There is some truth to this as apparent by the graph. India would be one of the largest economy with youngest citizens. While I would not explore this today but briefly would like to point out that India would reap an economic advantage only if it meets two NECESSARY but NOT SUFFICIENT CONDITIONS (to use title of Eli's book):
1. India can create Jobs at a rate faster than new employable youth joining the Employment pool. Most analysts underestimate the number of People joining this pool, as analysts do not factor in the increasing participation of Woman within this pool. This is a dramatic shift that would much far-reaching socio-economic consequences for India.
2. Indian youth needs to have skill-set that match the requirements of the Industrial growth. Every Business today is exposed to these constraints for growth and quite a few of them have spoken out against. Its here that the experiment of IT companies is worth noting out. ( As pointed out by Swaminathan Anklesaria Aiyar in his column here.). It’s interesting to note that this experiment is been expanded in to other Industries too: ACC in cement, Reliance in Oil and Gas, NPTI for Power.
That India would reap an Economic advantage of this "Demographic Dividend" is thus a function of these two variables, failure to manage them might lead to social problems much harder to manage. India needs huge push in this esp. as India gears towards one of the largest Infrastructure and Cap-ex build up in the History of the country. India thus needs more initiatives in development and matching of skill sets as reqired by the Industry: through increased Govt. spending, private initiatives including PPI.
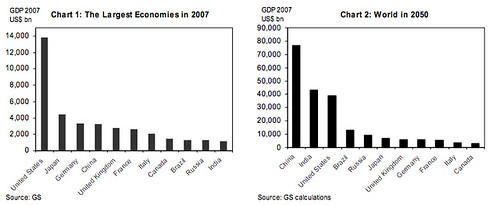
And then there is the Goldman Sachs study which projects China and India as the largest and second largest Countries by 2050.
Coming back to the first point, the best way to analyze this claim is to look at various economic parameters not on year on year basis but on the basis of Year since take-off, where in take-off is defined as year of major reforms. For China, most analysts accept 1978 as the year that really decided China's future economic course as Deng charted a new economic direction, for India, most analyst accept 1991 as the Year where India redefined its economic direction as first projected through the New Industrial Policy of 1991.
So how does India squares up to China when compared this way. Lets look at few data points that support the analyst viewpoint:
- Exports: India compares similar to China as far as Exports are concerned. As pointed by Morgan Stanley
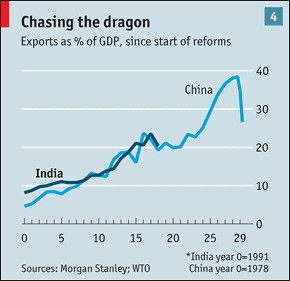 economists India's export growth as % of GDP since reforms bears a striking resemblance to China's since China's grand opening of 1978. And it is expected that it would continue a similar upward growth as India liberalizes its Economy and Multinationals view India as a significant Market and Production-Manufacturing site. This would be most notable in some sectors like Small car and Capital Goods. But its the service exports where India would lead most notably and needs to be watched out for, some of these might not contributing a lot in Dollar terms but would be the game changer nevertheless: India's rise as a R&D and Design hub for Global companies. (from GE, Cisco, Google, Texas Instruments, Bombardier, Honeywell India would figure significantly in the global calculus of Product innovations of Global companies as they try and leverage Indian experience across World most notably Africa).
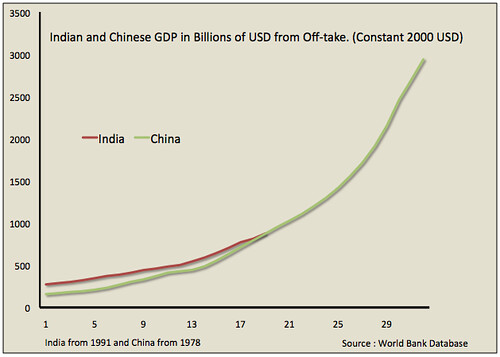
 - GDP: When we compare GDP figures of the two countries from take-off it seems that the striking resemblance that we observed in the Exports continues to play out in GDP too. India seems to be taking a similar Path. With GDP growth rate expected to overtake that of China it is expected by most analyst that there seems to be real possibility that Indian GDP figure may achieve the elusive 10% + growth rates that was the primary reason for the Rise of China and Japan as the Second and Third largest economies of the world today.
- Large Technical Work Force: With over 2.3 million students passing out of colleges annually, India has outperformed the US, Europe and Japan in having maximum
number of students graduating in Maths and science. According to a recent study, India also boosts of second largest pool of scientists and engineers in the world. This data is based on the study by Ernst and Young, conducted jointly with the Associated Chambers of Commerce and Industry (Assocham).The study reveals that India ranks 17th based on this parameter, against 48th ranking for the US, 33rd for Japan and 38th for China.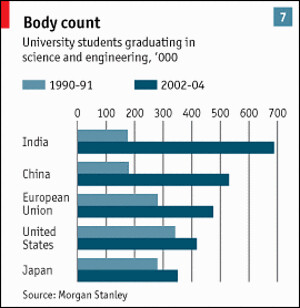 Germany, according to the study, ranks first, followed by Singapore and France. "The number of science and engineering graduates is an important consideration. There are 690,000 students of science and maths graduating every year -- much higher than China, Japan, the US and Europe," said D S Rawat, secretary general of Assocham. In China, the number of such graduates each year is 530,000, against 350,000 in Japan, 420,000 in the US and 470,000 in the EU. Some key facts about Indian education highlighted by the study are:
-
- More than 2.3 million graduates every year.
- Nearly 750,000 post-graduates per annum.
- Second largest pool of scientists and engineers in the world.
- Second largest number of trained doctors.
The Chinks in the Armor for this Reasoning:
From the above discussion it seems that India is poised for an unprecedented period of Growth in the coming decade generally mimicking China over last decade. But the above arguments hides some unique weakness when the same data sets are compared differently and with other Emerging nations across various time lines Japan from 1955, NIE from 1967, ASEAN-4 from 1973 (NIE comprises of Hong Kong, Singapore, Korea & Taiwan. ASEAN-4 comprises of Indonesia, Malaysia, Philippines, Thailand)
1. Productivity Growth in Japanese, Chinese and Indian economy from Take-off period : The productivity of all the three countries expanded from their year of Liberalization/ Reforms. The growth was more pronounced in China as it expanded its reform exercise from Agriculture to other areas of economy.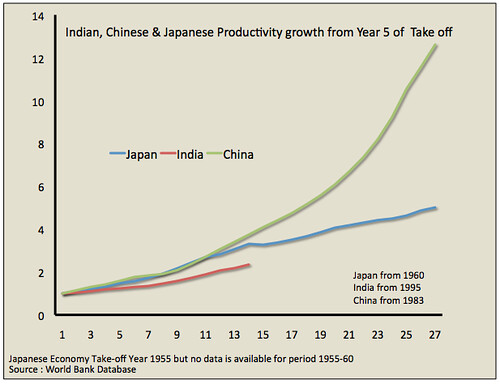 About a decade and a half after reforms the growth had already leap frogged ahead of comparable period for Japan and was significantly more than what India could achieve by 2005-06. In August 1980, the National People's Congress (NPC) passed "Regulations for The Special Economy Zone of Guangdong Province" starting the process for setting up SEZ across the coastal belt But perhaps the biggest reason for Chinese over performance would be its relative underperformance in the initial years because of Cultural Revolution and other policies by Chairman Mao that targeted the intelligentsia, traders and curbed intellectual dissent. As Deng removed these controls Chinese economy expanded. The case with India was similar as the Government successively removed controls across various sections of Economy, that part of the Economy grew faster. The only reason for difference between the Indian and Chinese growth seems to be :
About a decade and a half after reforms the growth had already leap frogged ahead of comparable period for Japan and was significantly more than what India could achieve by 2005-06. In August 1980, the National People's Congress (NPC) passed "Regulations for The Special Economy Zone of Guangdong Province" starting the process for setting up SEZ across the coastal belt But perhaps the biggest reason for Chinese over performance would be its relative underperformance in the initial years because of Cultural Revolution and other policies by Chairman Mao that targeted the intelligentsia, traders and curbed intellectual dissent. As Deng removed these controls Chinese economy expanded. The case with India was similar as the Government successively removed controls across various sections of Economy, that part of the Economy grew faster. The only reason for difference between the Indian and Chinese growth seems to be : - China began its reforms process with Agricultural reforms where as Agricultural reforms have not be taken by Indian govt. Most notably, one state where Government has been most supportive of Agricultural reforms has been Gujarat, and its not surprising that Agricultural growth in Gujarat has averaged 9.6% between 2000-01 and 2007-08 this is twice the National average. (The full paper by IFPR can be had here).
- Chinese SEZ policy has been more consistent, comprehensive than India even though Indian SEZ policy as formulated gives much better tax incentives. Chinese SEZ policy focussed more on formation of Industrial Clusters around costal cities. These SEZ enjoyed more autonomy in governance than the rest of China.
- Chinese growth was largely focussed on developing an Manufacturing Export oriented economy where it tried to leverage it lower cost and Economies of Scale to rapidly become the Factory of the World. Where as Indian entrepreneurs and Industrial houses (exception of Reliance Industries) focussed more on becoming globally competitive in Service Economy.
- Further and perhaps more importantly India took a deliberate step of Gradualisation of reforms as Montek Singh says : "gradualism implies a clear definition of the goal and a deliberate choice of extending the time taken to reach it, in order to ease the pain of transition" (Montek Singh: Economic Reforms in India Since 1991: Has Gradualism Worked).
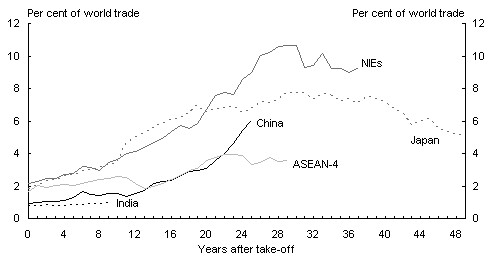
Significantly India's share of Global trade has lagged behind most emerging nations during their period of Growth. This means while India has remained relatively insulated from the vagaries of Global Economy but it is also less poised to take advantage of growth in other parts of the world like Indonesia, Sri Lanka, Vietnam, Turkey etc. (Countries defined by Goldman Sachs as N-11.) For India to grow at the rate of Chinese growth over last decade India would have to participate more vigorously in the international trade.
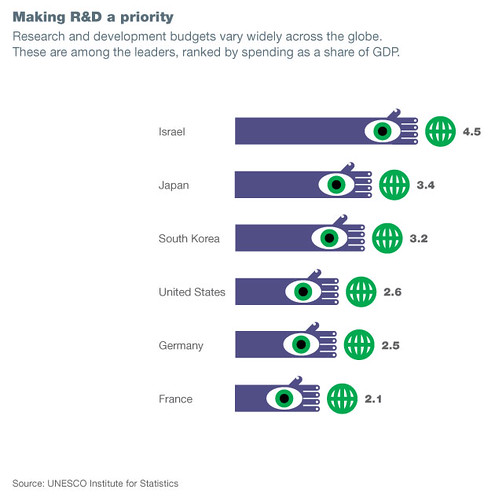 3. R&D spending as Percentage of GDP : In March 2008 replying during question hour Science and Technology Minister Kapil Sibal informed Rajya Sabha: "“This is a very big issue,”. R&D spending as percentage of GDP in India is only 0.8% as compared to China's 1.23%. Developed countries have R&D expenditure of up to 3% of GDP. As per an article by R&D Mag in Dec 2009 :"Brazil, Russia, India, and China will dominate future R&D growth, overwhelming Europe and Japan and, eventually, matching the investments in the U.S. At the current levels of spending, China alone will outspend Japan in R&D in mid-2010, match assumed aggressive spending in all of Europe combined in 2018, and match U.S. R&D spending in 2022." (the complete article is available here).
 Till 2008 Israel remained the largest spender in R&D in terms of % of GDP followed by Japan, South Korea, United States, Germany, and France.
While both India and China would have to increase their R&D spends, given huge global issues from Climate change and Clean Technologies to Development of Alternative energy , the future of a SUSTAINED Growth for a Country would necessitate an increased spending in R&D and development of new Innovative products and services.
Conclusion
Given these its entirely probable that India would evolve that is at divergence from expectations of most Analysts. What I truly believe is that the next decade is an inflexion point where in India would have to address the following issues and get its act together before it can emerge in 2050 as the Second largest economy or better and close the ouptut gap with China. The Eleven point Agenda as put forth primarily by Goldman Sachs Research best sums up the Points on which to work for Indian policy makers, business leaders and citizens of India :
1. Governance : India’s governance problems overarch all its other problems. Without better governance, delivery systems and effective implementation, India will find it difficult to educate its citizens, build infrastructure, increase agricultural productivity, and ensure that the fruits of economic growth are well-distributed.
2. Raise educational achievement. Among more micro factors, raising India’s educational achievement is a major requirement to help achieve the nation’s potential. According to basic indicators, a vast number of India’s young people receive no (or only the most basic) education. A major effort to boost basic education is needed. A number of initiatives, such as a continued expansion of Pratham and the introduction of Teach First, for example, should be pursued.
3. Increase quality and quantity of universities and Technical Institutes esp. ITI. At the other end of the spectrum, India should also have a more defined plan to raise the number and the quality of top universities.
4. Control inflation. Although India has not suffered particularly from dramatic inflation, it is currently experiencing a rise in inflation similar to that seen in a number of emerging economies. A formal adoption of Inflation Targeting would be a very sensible move to help India persuade its huge population of the (permanent) benefits of price stability.
5. Introduce a credible fiscal policy. India should introduce a more credible medium-term plan for fiscal policy. Targeting low and stable inflation is not easy if fiscal policy is poorly maintained. It would be helpful to develop some ‘rules’ for spending over cycles.
6. Liberalise financial markets. To improve further the macro variables, further liberalisation of Indian financial markets is necessary, financial inclusion of those left out from the organized financial institutions would have to be brought in to the fold to make the credit and savings facility available to them. This may necessitate use of innovative new business models and use of Technology. Financial Products and services like M-Pesa which has worked successfully in Kenya needs to be explored for its feasibility in India.
7. Increase trade with neighbours. In terms of international trade, India continues to be much less ‘open’ than many of its other large emerging nation colleagues, especially China. Given the significant number of nations with large populations on its borders, it is recommend that India target a major increase in trade with China, Pakistan and Bangladesh.
8. Increase agricultural productivity. Agriculture, especially in these times of rising prices, should be a great opportunity for India. Better specific and defined plans for increasing productivity in agriculture are essential, and could allow India to benefit from the BRIC-related global thirst for better- quality food.
9. Improve infrastructure. Focus on infrastructure in India is legendary, and tales of woe abound. Improvements are taking place, as any foreign business visitor will be aware, but the need for more is paramount. Without such improvement, development will be limited.
10. Improve Environmental Quality. The final area where greater reforms are needed is the environment. Achieving greater energy efficiencies and boosting the cleanliness of energy and water usage would increase the likelihood of a sustainable stronger growth path for India.
11. Improve R&D Spend. A sustainable growth for India would evolve from Innovation in products and services that India needs to develop for the uniques sets of challenges it faces these products and services can then also be exported to other places around the globe . India needs to develop policy frameworks that help attract Multinational Companies to set-up R&D centers in India. Evolve mechanisms where Universities and Institutes can collaborate with Industries in developing new technologies, conducting research in Basic Sciences.
Perhaps not all these ‘action areas’ can be addressed at the same time, in coming years, progress will have to be made in all of them if India is to achieve its very exciting growth potential.